How to Sketch a System Context Diagram in Excalidraw
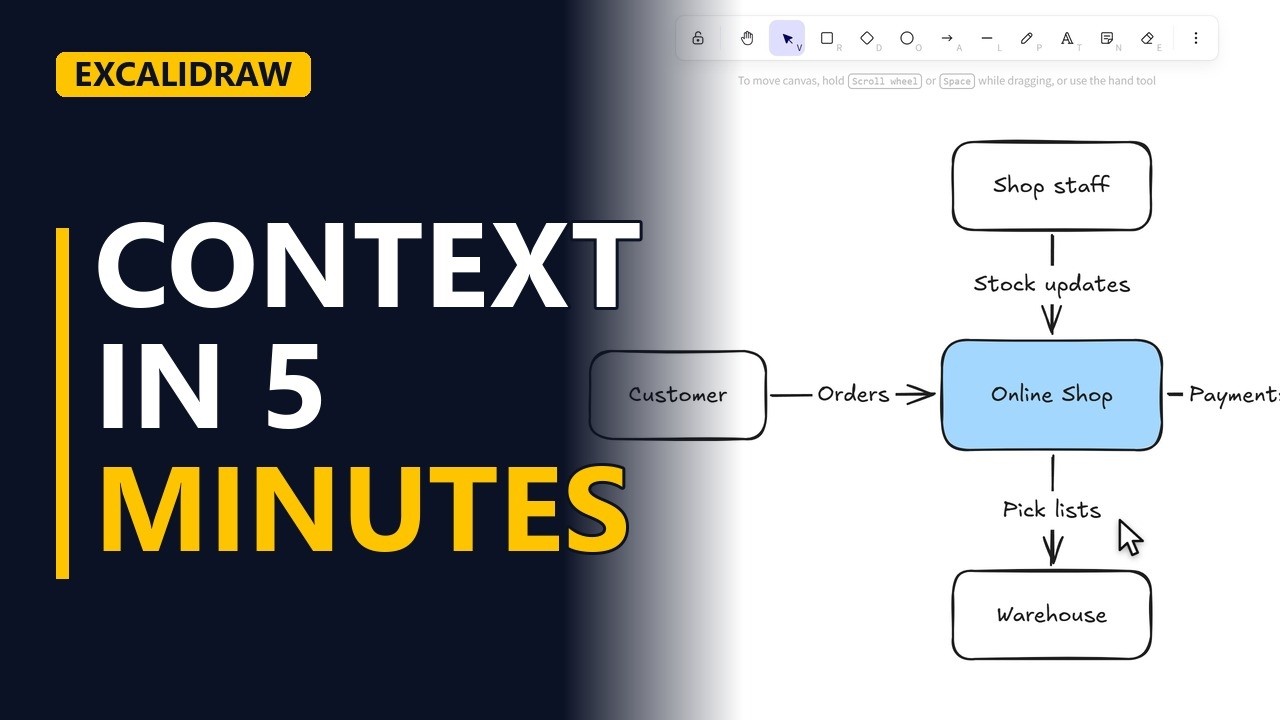
A system context diagram shows your system in the middle and everyone it talks to around it. Sketch one in Excalidraw: the system, the people and systems outside it, labelled arrows for what flows between them, and an export to PNG for your requirements document. Example: a made-up online shop.
Step by step
What a context diagram shows
- System context. Before you write a single requirement, agree on the scope. A context diagram shows the system in the middle and everyone it talks to. Here's the one we'll sketch for our online shop.
- excalidraw.com. Open excalidraw.com with an empty canvas.
The system
- The system. Your system goes in the middle. Draw a big rectangle and call it online shop.
Who it talks to
- Outside parties. Everything else is outside the system. The customer goes on the left.
- Label the flows. Draw an arrow to the shop, press Enter and say what flows. Orders.
- Outside parties. On the right, the payment provider. Another system, but not ours.
- Label the flows. The shop sends it payments.
- Outside parties. Below, the warehouse that packs the orders.
- Label the flows. The shop sends it pick lists.
- Outside parties. And on top, the shop staff who keep the stock up to date.
- Label the flows. Their arrow carries stock updates into the shop.
Show the scope
- In scope. Now select the online shop and give it a light blue background, so everyone sees what's in scope.
- The finished diagram. Click an empty spot. One system, four outside parties, and every arrow says what it carries.
Export
- Export. To put it in your requirements, open the menu, choose export image, and click PNG.
Recap
- The rules. So, the system in the middle, every outside party around it, and a label on every arrow. If it isn't on the diagram, it's out of scope. Subscribe for more Excalidraw tips for business analysts.


