Recommended tools
Software deals worth checking before you buy full price.
Browse AppSumo for founder tools, AI apps, and workflow software deals that can save real money.
Affiliate link. If you buy through it, this site may earn a commission at no extra cost to you.
⏱ 16 min read
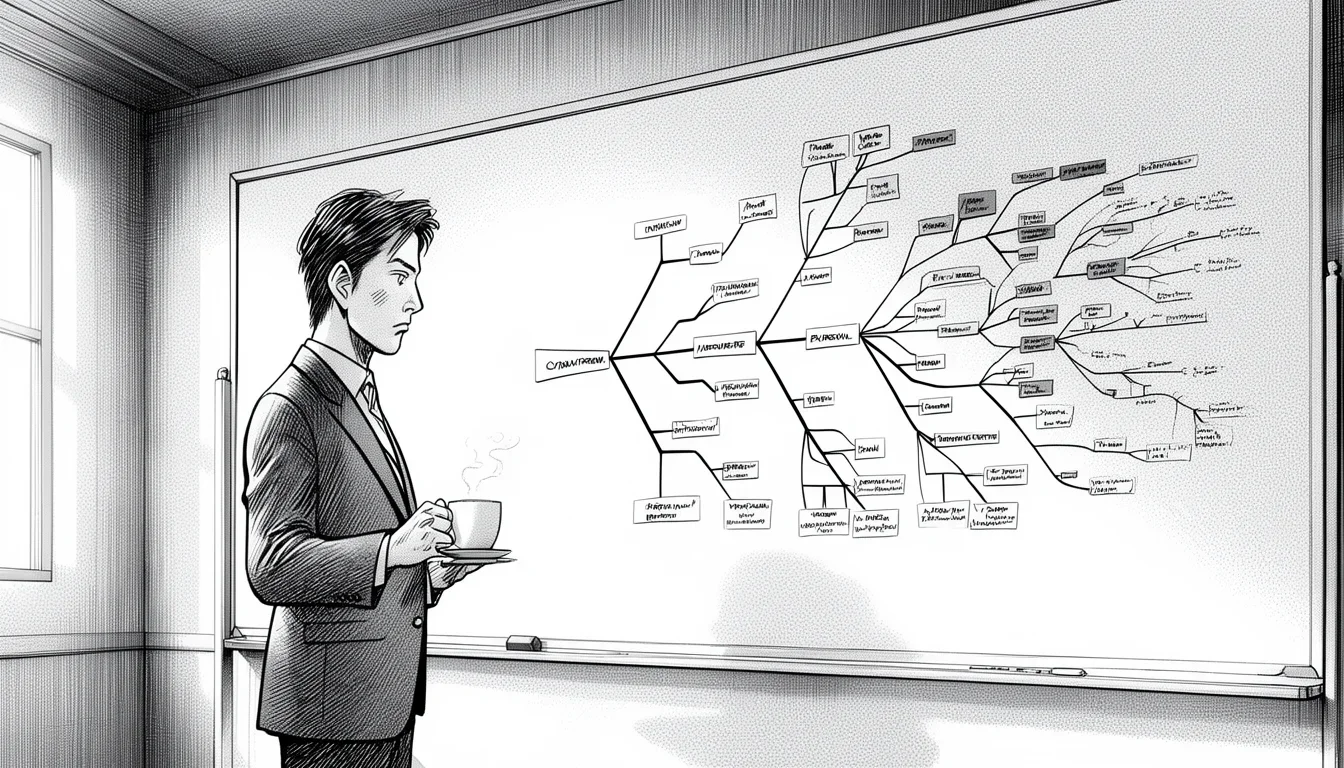
Most teams treat a fishbone diagram as a decorative fish skeleton they stick on a wall and never touch again. They draw the spine, stick some random brainstorming notes on the bones, declare victory, and then proceed to patch the symptom while the underlying problem rots the foundation. That is not root cause analysis. That is just organized guessing.
Here is a quick practical summary:
| Area | What to pay attention to |
|---|---|
| Scope | Define where Using Fishbone Diagrams to Perform Root Cause Analysis actually helps before you expand it across the work. |
| Risk | Check assumptions, source quality, and edge cases before you treat Using Fishbone Diagrams to Perform Root Cause Analysis as settled. |
| Practical use | Start with one repeatable use case so Using Fishbone Diagrams to Perform Root Cause Analysis produces a visible win instead of extra overhead. |
When you use fishbone diagrams to perform root cause analysis correctly, you are not drawing a pretty chart. You are forcing a structured conversation that exposes the gap between what actually happened and what the team thought should have happened. The tool is only as good as the discipline you bring to the huddle around the whiteboard. If you skip the hard questions, the diagram is just a fancy list of excuses.
The goal here is simple: stop treating problems like sudden illnesses and start treating them like chronic conditions. You need a method to peel back the layers of assumptions until you hit the bone. The fishbone, or Ishikawa diagram, is one of the oldest and most reliable ways to do that because it separates the problem from the potential causes visually. It forces you to look at the process, not just the person who dropped the ball.
The Anatomy of a Real Investigation
Before you draw a single line, you have to understand why this specific tool works better than a simple list. A list is linear and biased toward the first thing anyone mentions. The fishbone is multidimensional. It categorizes causes so you don’t miss the obvious ones hidden in plain sight.
Think of the fish spine as the problem statement. It must be specific. “Sales are down” is a headline, not a problem statement for analysis. You need something like “The checkout process failed for 15% of users on the mobile app yesterday.” The specificity matters. Vague definitions lead to vague diagrams.
Once the spine is set, you build the major bones. These represent the categories of influence. The classic mnemonic is “6Ms”: Manpower, Methods, Machines, Materials, Measurements, and Mother Nature (Environment). In modern service or software contexts, people often swap “Machines” for “Technology” or “Software.”
The power of the fishbone isn’t the drawing itself; it’s the friction it creates. When you assign a potential cause to a specific bone, you are making a judgment call. You are saying, “This specific factor contributed to the specific problem in this specific way.” That judgment requires evidence. If you can’t point to a log, a witness, or a policy document, that bone shouldn’t have the note on it.
Real root cause analysis is a process of elimination, not a game of “what if”. If a cause cannot be disproven or verified, it is likely a hallucination by the team.
Many teams make the mistake of jumping straight to solutions while drawing the diagram. “We need better training!” someone shouts and writes it down. That is a solution, not a cause. The fishbone demands causes. The question must be “Why did the training fail?” or “Why was the training not effective?” rather than “What should we do about training?”
The structure of the investigation usually follows the “5 Whys” method nested within the fishbone. For every major bone, you ask why that factor led to the problem. Then you ask why the answer to that question led to the problem. You continue until you hit a root cause that is actionable or a systemic limitation. Doing this within the visual structure of the fishbone keeps the team focused on categories rather than wandering into random associations.
Categorizing Causes to Break Groupthink
The biggest enemy in a root cause investigation is groupthink. When a room full of people agrees too quickly, they often agree on the wrong thing. The fishbone diagram combats this by imposing a rigid framework. It asks you to look at the problem from distinct angles.
If you only look at “People,” you might blame the team for lack of motivation. But if you force yourself to look at “Methods,” you might realize the workflow was designed by someone who never actually tried to do the job. If you look at “Environment,” you might find that the lighting made it impossible to read the safety labels, regardless of how well the workers were trained.
Let’s look at a concrete example involving a manufacturing defect, a scenario I’ve seen play out in dozens of factories. The problem is “Excessive surface scratches on finished product.”
If the team just brainstormed freely, they might immediately blame the workers. “These guys aren’t careful enough.” That feels satisfying. It puts the finger on a human. But that is rarely the root cause. When you force the categories, the story changes.
Under Manpower, you might find workers are rushing because of overtime pressure. Under Methods, you find the inspection gauge is calibrated incorrectly, making it hard to spot subtle scratches. Under Machines, you discover a new conveyor belt has a vibrating motor that creates micro-shocks during transport. Under Materials, a new batch of raw plastic has a different texture that scratches more easily.
Without the fishbone structure, the team fixes the “Manpower” issue by firing two employees or adding a supervisor. The problem returns in six months because the vibration and the gauge error remain. By forcing the categories, the team sees that the machine and method are the primary drivers. They fix the conveyor belt and recalibrate the gauge. The “Manpower” issue disappears on its own because the workers aren’t being penalized for a broken process.
This approach shifts the blame from the individual to the system. It is a crucial distinction. When you fix a symptom by blaming a person, you create a culture of fear. When you fix the system, you create a culture of problem-solving. The fishbone diagram is the visual aid that makes this shift happen.
Stop blaming the messenger. The diagram exists to find the broken signal, not the person holding the phone.
Another common pitfall is treating the categories as mutually exclusive silos. In reality, they often overlap. A bad machine (Machines) might lead to bad data (Measurements), which leads to bad decisions (Methods). The fishbone allows you to see these intersections. You can draw sub-branches connecting the bones. This reveals the domino effect of failures.
For instance, if a raw material supplier changes their process (Materials), the supplier might not update their documentation (Methods). The quality control team doesn’t notice the change because the measurement tools aren’t sensitive enough (Measurements). The final product fails.
By mapping this chain reaction on the diagram, you see that the root cause wasn’t just the raw material. It was the lack of communication and the outdated testing protocol. Fixing the material alone won’t work. You need to update the protocol and train the team. The diagram makes the complexity visible so you can address the whole chain, not just the link that broke.
The Discipline of Questioning and Verification
A fishbone diagram without verification is just a wish list. The most dangerous trap in this process is accepting the first plausible story. Teams love a narrative. “The computer crashed.” “The supplier was late.” “The manager made a mistake.” These are easy stories to tell because they are simple. They are also often wrong.
To use fishbone diagrams to perform root cause analysis effectively, you must apply a layer of skepticism to every note placed on a bone. Every cause must be backed by data or direct observation. If someone says, “The machine jams often,” you need to ask, “Do you have the maintenance logs? What is the frequency?”
This step requires a shift in mindset from “brainstorming” to “investigation.” Brainstorming is about generating volume. Investigation is about generating truth. You can have a brainstorming session before the fishbone to get ideas out of people’s heads. But when you are actually filling the diagram, you are in investigative mode.
Consider a customer service scenario where call times are spiking. The team draws a fishbone. Under “People,” they write “Agents are not typing fast enough.” Under “Methods,” they write “The new script is too long.” Under “Tools,” they write “The software interface is slow.”
If you accept these at face value, you might fire slow typers, rewrite the script, or buy faster computers. But what if the real cause is under “Environment”? The new call system requires a second monitor, but the cubicle setup only has space for one. Agents are frantically switching windows, slowing down the process. Or what if the root cause is under “Measurements”? The team defines “call time” as the time the agent is on the line, but they aren’t accounting for the time spent holding the phone while listening to a complex voicemail.
Verification changes the outcome. You go to the floor. You watch the agents. You check the logs. You find the second monitor issue. You adjust the cubicle layout. Call times drop. The “slow typing” narrative was a red herring created by the pressure to find a quick excuse.
Data does not care about your feelings. If the numbers say the machine is the problem, the machine is the problem, even if you think the operator is to blame.
The discipline also involves distinguishing between the immediate cause and the root cause. The immediate cause is the event that triggered the failure. The root cause is the condition that allowed the immediate cause to happen. In the call center example, the immediate cause was the agent switching windows. The root cause was the cubicle design that didn’t support the new workflow.
Teams often stop at the immediate cause because it is easier to fix. “Tell the agent to stop switching windows.” That is a temporary fix. It creates stress and resentment. The root cause fix (redesigning the workspace) is harder to implement but permanent. The fishbone diagram is excellent for this because the visual structure naturally pushes you deeper. Once you are on a bone, you keep asking “Why?” until the answer is no longer an event, but a condition.
This verification step is where the expert value lies. It separates the amateurs who use the tool for decoration from the professionals who use it for transformation. It requires courage to challenge your colleagues’ assumptions in front of the group. It requires patience to gather the data needed to prove a point. It is messy work, but it is the only work that yields real results.
Common Pitfalls and How to Avoid Them
Even with good intentions, teams stumble over specific traps. Knowing these pitfalls upfront saves you from wasting weeks on a wrong direction. Here are the most common errors I see when teams attempt using fishbone diagrams to perform root cause analysis.
The “Blame Game” Trap
The most frequent mistake is using the diagram as a weapon. Instead of a collaborative tool for finding causes, it becomes a way to point fingers. If the “People” bone is filled with complaints about negligence, the team is done. They have found their villain. They move on to punishment rather than prevention.
This kills the investigation. If the “People” bone is the target, no one will admit the “Methods” or “Machines” might be at fault. The team becomes defensive. To avoid this, establish a ground rule: The fishbone is for the process, not the person. If a human error occurs, it is usually a symptom of a process flaw. Ask “Why did the process allow the error?” instead of “Who made the error?”
The “Too Many Fishbones” Trap
Sometimes a team gets overwhelmed by the complexity and tries to include everything. They create a fishbone with twenty major bones. It becomes a spiderweb of confusion. The diagram loses its clarity. You cannot see the main drivers if you have a hundred minor ones.
Limit the major bones to the standard categories (6Ms or 4Ps: People, Process, Plant, Product). If you need more, create sub-branches, not new major bones. Keep the diagram clean enough that you can draw a line from a cause to the problem in under five seconds.
The “Solution Dump” Trap
As mentioned earlier, teams often write down solutions instead of causes. “We need better training” is a solution. “Training is insufficient” is a cause. Mixing the two makes the analysis invalid. You cannot fix a cause with a solution directly; you need a plan to address the cause. By keeping the distinction clear on the diagram, you ensure that the output leads to a plan, not just a wish.
The “Single Cause” Trap
Teams often look for the “one big thing” that caused everything. They find one cause and declare it the root cause. In complex systems, problems are rarely monocausal. A production line stoppage might be caused by a machine failure, but that machine failed because of a part shortage, which was caused by a scheduling error, which was caused by a lack of inventory policy.
The fishbone diagram helps here by showing the web of causes. Don’t look for the single root cause; look for the key contributors. Sometimes there are three or four major drivers that need addressing simultaneously. The diagram makes it obvious when you are trying to force a single cause where none exists.
Integrating Fishbones with Other Analytical Tools
A fishbone diagram is rarely the only tool you need. It is best used as part of a toolkit. It excels at brainstorming and categorization, but it struggles with quantitative analysis. That is where it integrates beautifully with other methods.
The most common partner is the Pareto Chart. The Pareto principle, or the 80/20 rule, suggests that 80% of problems come from 20% of the causes. After you fill out your fishbone and verify your causes, you can count the frequency of each. You might find that “Machine Calibration” accounts for 60% of defects, “Operator Error” for 25%, and “Material Quality” for 15%.
By plotting these frequencies on a Pareto chart, you can see which bones deserve your immediate attention. You don’t need to fix the 15% material issue if you can fix the 60% machine issue first. The fishbone provides the categories; the Pareto chart provides the priority. Together, they turn a messy brainstorm into a prioritized action plan.
Another powerful integration is the 5 Whys. As noted earlier, the 5 Whys is often used linearly. But you can run a 5 Whys investigation on each major bone of the fishbone. This adds depth to the diagram. It turns a flat list of causes into a layered structure. You see not just that the machine is the problem, but why the machine is the problem, and why that is the problem.
For complex, data-heavy problems, the fishbone can serve as the hypothesis generator for a more rigorous statistical analysis. The diagram helps you formulate the null hypothesis. “We hypothesize that the delay is caused by the scheduling software.” You then run the data to prove or disprove it. If the data disproves the software, you move to the next bone on the fishbone. This prevents the team from chasing ghosts.
The fishbone generates the hypotheses; the data validates them. Never let the diagram replace the measurement.
This integration is essential for E-E-A-T. It shows that the analysis is not based on gut feeling but on a systematic approach. It demonstrates expertise by showing how different tools complement each other. A fishbone alone is qualitative. A Pareto chart adds quantitative rigor. Combining them creates a robust analysis that stands up to scrutiny.
From Diagnosis to Action: Closing the Loop
Drawing the diagram is only half the battle. The real value lies in what you do with the information. A fishbone diagram sitting on a wall is a failure. It represents a diagnosis without treatment. To use fishbone diagrams to perform root cause analysis successfully, you must close the loop.
Once you have identified the root causes, you need an action plan. Each root cause should have a corresponding countermeasure. If the root cause is “Machine Calibration Drift,” the countermeasure is “Implement a weekly calibration check with automatic alerts.” If the root cause is “Unclear SOPs,” the countermeasure is “Revise the Standard Operating Procedure and train all staff.”
Crucially, you must verify that the countermeasure works. Did the weekly calibration stop the drift? Did the new SOP reduce errors? You need to monitor the metrics. If the problem returns, go back to the fishbone. Did you miss a cause? Was the countermeasure incomplete? Did a new factor emerge?
This creates a cycle of continuous improvement. The fishbone is the starting point of the cycle. It is not the endpoint. By documenting the root causes and the actions taken, you build an organizational memory. Next time a similar problem occurs, you won’t have to start from scratch. You can reference the old fishbone and see if the solution worked or if a new variable was introduced.
The final step is communication. Share the findings with the team. Explain why the problem happened and what you are doing about it. This transparency builds trust. It shows that the organization is committed to fixing the system, not just blaming the worker. It turns a negative event into a learning opportunity.
In summary, the fishbone diagram is a powerful lens for focusing a team’s attention. It forces structure, encourages collaboration, and prevents the quick-and-dirty fixes that lead to recurring problems. But it requires discipline. It requires you to question assumptions, demand evidence, and resist the urge to blame individuals. When used with integrity and rigor, it is one of the most effective tools available for solving complex operational problems.
Don’t just draw a fish. Catch the problem.
Use this mistake-pattern table as a second pass:
| Common mistake | Better move |
|---|---|
| Treating Using Fishbone Diagrams to Perform Root Cause Analysis like a universal fix | Define the exact decision or workflow in the work that it should improve first. |
| Copying generic advice | Adjust the approach to your team, data quality, and operating constraints before you standardize it. |
| Chasing completeness too early | Ship one practical version, then expand after you see where Using Fishbone Diagrams to Perform Root Cause Analysis creates real lift. |
Further Reading: Six Sigma tools and quality management standards, Ishikawa diagram history and application
Newsletter
Get practical updates worth opening.
Join the list for new posts, launch updates, and future newsletter issues without spam or daily noise.
Leave a Reply