User Story Mapping: 4 Parts and 5 Steps Every Business Analyst Should Know
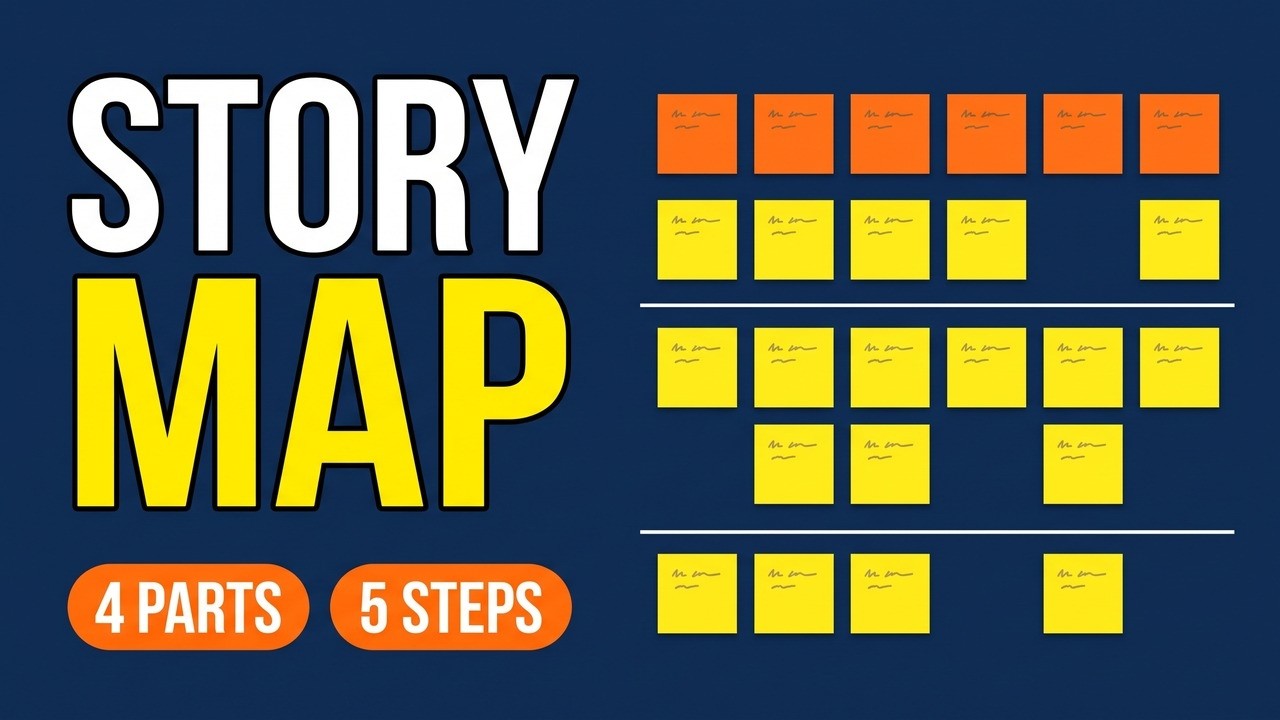
"Where do we start?" "All of it." That's what a flat backlog gets you. In this video I take one new feature for a made-up online shop, a wish list, and do user story mapping start to finish: what a story map really is, 4 parts to learn it by (the backbone, the stories underneath, the walking skeleton, the release slices), 5 steps to build one in a workshop, the finished map with three slices, and the 5 mistakes to avoid.
Step by step
A list hides the story
- A backlog is a flat list, and a list hides the story. In the online shop example, the sales manager wants a wish list before December and the team wrote 30 user stories in one long list. A story map lays them out as the user's journey instead.
Part 1: the backbone
- Part 1 is the backbone, across the top. Its top layer is the activities (Save an item, View the list, Share the list, Buy from the list). Under each sit user tasks, such as pick an item, then save it. Start each note with a verb and describe what a person does, not the system.
Part 2: the stories underneath
- Part 2 is the stories underneath. Under each user task hang smaller stories. Under save: save from the product page, save without an account, save from search results. Under share: copy a link, email the list, let a friend mark an item as bought. The must-have goes at the top of its column.
Part 3: the walking skeleton
- Part 3 is the walking skeleton: the thinnest slice across the whole backbone that still works end to end. Here it is save from the product page, see the list, copy a link and add one item to the cart. It isn't pretty, but it shows early whether the pieces fit together.
Part 4: release slices
- Part 4 is release slices. Draw a line across the map, left to right. Everything above it is one slice, and another line makes the next. Each slice cuts through every column, so it is a full journey. Give each slice a goal, not just a number.
Explain like I'm 5: a day at the beach
- Think of a day at the beach. A packing list of 40 items doesn't show what is missing. Telling the day as a story does: drive there, set up, swim, eat lunch, drive home. Nobody packed lunch. A story map shows the gaps in a product the same way.
A map has two directions
- A story map is a grid with two directions. Left to right is the order the user does things, which Jeff Patton calls the narrative flow. Top to bottom is priority: must-haves at the top, nice extras lower. One picture shows the journey and what comes first.
Prepare the mapping workshop
- Prepare a workshop, because a map is built together. For the shop, invite 5 people: the sales manager, a developer, a tester, a customer service agent and a real shopper. Book 90 minutes, bring a big wall or online whiteboard and sticky notes, and write one question at the top.
Step 1: frame it
- Step 1: frame it. Agree who it is for and the goal before any note goes up. Here the users are the shopper and the friend who opens the link. The goal: a shopper can save gift ideas and share them with a friend before December. Write both at the top.
Step 2: tell the story
- Step 2: tell the story. Ask what the shopper does first, then next. Put each answer on a sticky note starting with a verb, in order, left to right. Don't argue details yet. Then group the notes and name each group (save, view, share, buy). These are the activities that form the backbone.
Step 3: explore
- Step 3: explore. Go column by column and ask what else the user might do and what could go wrong. The customer service agent says saved items sell out, so the list must show stock. The shopper doesn't want to make an account. That adds two new notes that weren't in the 30 stories.
Step 4: slice the walking skeleton
- Step 4: slice the walking skeleton. Under each activity pull up the one story the journey can't work without. Ask what the least is to get to the next column. Draw a line under those 4 stories. The developer builds this slice first and the shop's staff try it out.
Step 5: slice the releases
- Step 5: slice the releases. Look at what's left and ask what must be there when shoppers see it in December. Draw a line: that is the holiday launch. Everything below it is the later slice, such as saving from search results, more than one list, and a price-drop email.
Worked example: the finished story map
- The finished map has the backbone across the top and three slices under it. Slice 1 is the walking skeleton. Slice 2 is the holiday launch (size and colour, save without an account, price and stock, email the list, add the whole list to the cart). Slice 3 is for later.
Confirm: walk the map
- Walk the map by reading each slice out loud like a story to the people who asked for it. Ask the sales manager if the holiday slice is enough for December. Ask the customer service agent to check that out of stock is in. If a slice doesn't make sense as a story, a card is missing or misplaced.
Where the map goes
- Take a photo of the wall so nothing is lost. Then put the stories into your backlog tool, such as Jira, and keep two labels from the map on each story: its activity and its slice. Write up the goal of each slice with the photo on a Confluence page, and update the map as you learn.
5 common mistakes
- Five mistakes: mapping the system instead of the user, building one column at a time instead of slicing across, making the first slice too fat, mapping alone, and mapping once and never looking again.
Recap
- A list hides the story and a map shows it. Left to right is the journey and top to bottom is priority. Learn the 4 parts (backbone, stories underneath, walking skeleton, release slices) and the 5 steps. Give every slice a goal and walk the map out loud.
Common mistakes
- Mapping the system, not the user. If your backbone says database, admin and reports, you have drawn the system. Write verb notes for things a person does, such as pick an item, save it, copy a link.
- Building one column at a time. A perfect save button with no list to look at helps nobody. Slice across the whole backbone, so each slice is a working journey from start to end.
- A fat first slice. If everything sits above the first line, you haven't sliced. Ask what the least is that gets the user to the next column, and keep only that in the walking skeleton.
- Mapping alone at your desk. Gaps show up only when the people who know the work are in the room. Invite a developer, a tester, a support person and a real user.
When a business analyst uses this
A BA runs a 90-minute workshop for a new feature, such as a wish list, with the sales manager, developer, tester and a real user. The map turns a flat list of 30 stories into 3 slices with goals, which the BA then puts into Jira with an activity and slice label.
Questions people ask
What is user story mapping?
It is a way to lay user stories out as a map of the user's journey. Left to right is the order the user does things, and top to bottom is priority. It shows what the product does and what to deliver first.
Who invented user story mapping?
Jeff Patton is the person most linked with it, and he wrote the book User Story Mapping. The walking skeleton idea comes from Alistair Cockburn.
How do you run a user story mapping session?
Invite people who know the work, such as a developer, tester, support agent and a real user, and book about 90 minutes. Frame the goal, tell the story, explore, slice the walking skeleton, then slice the releases.