Root Cause Analysis: 4 Steps, the Fishbone Diagram and the 5 Whys (Full Example)
"Customers keep getting the wrong item. We need a new warehouse system." Is that the problem? Not yet. In this video I take one messy problem from a made-up online shop and run a full root cause analysis: the 4 steps from the BABOK Guide, a sharp problem statement in 5 questions, the fishbone diagram, the 5 whys, how to check the cause with data, and the 5 mistakes to avoid.
Step by step
Most problems are symptoms
- Most problems that land on your desk are symptoms: sales are down, orders are late. Fix only the symptom and it comes back. Root cause analysis finds where the problem starts so you can fix it there. The example here is one problem at a made-up online shop.
Explain like I'm 5: the leaking roof
- Think of a leaking roof. A bucket under the drip treats the symptom, and it fills again at the next storm. The real fix is the 1 cracked tile on the roof. Root cause analysis is how you find that tile.
The four steps (BABOK)
- The BABOK Guide lists root cause analysis as 1 of its 50 techniques, in 4 steps: define the problem; collect the data (how often, where, since when, how big); identify the cause; identify the action. There can be more than 1 root cause, so you may go round the steps more than once.
Reactive or proactive, and who to bring
- Use it reactively, after something goes wrong, or proactively, to find weak spots early. Bring the people who touch the problem: here the warehouse lead, a picker, a packer, customer service and whoever can pull the order data. Look for causes, not culprits, so people speak freely.
The messy problem
- The customer service manager says: customers keep getting the wrong item, we need a new warehouse system. That mixes a symptom (wrong items) with an expensive solution, and nobody has asked why. Write a sharp problem statement with 5 questions: what exactly, where, when, how big, and so what.
Questions 1-2: what exactly, and where
- What exactly goes wrong? Look at 3 real orders together: it's the right shirt in the wrong size. Where? Almost only in the main warehouse of 2, mostly clothing. Where it doesn't happen is a clue too: the small warehouse is fine, so ask what's different about the main one.
Questions 3-4: when, and how big
- When did it start? In March. Ask what changed then: new seasonal pickers started and packing got faster. These are clues, not answers. How big? 6 in every 100 clothing orders now ship the wrong item, up from about 1 in 100. The number also gives you a target to prove the fix later.
Question 5 and the problem statement
- So what? Each wrong item means a refund or new parcel, a return label and often a bad review: about $8,000 a month. The statement: since March, 6 in 100 clothing orders from the main warehouse ship the wrong item, mostly the wrong size, up from 1 in 100. It has no cause and no solution in it.
Step 2: collect the data
- Step 2 gathers the nature, size, location and timing of the problem. Go deeper with facts: pull the order and return records, read the return reasons customers typed, count complaints by product, and walk the warehouse floor for an hour. Collect before you blame.
Three tools: wide, deep, proof
- Step 3 identifies the cause with 3 tools. The fishbone diagram goes wide and collects every possible cause in groups. The 5 whys go deep on 1 cause. Then you check the cause with data, because a fishbone only gives you possible causes.
Tool 1: draw the fishbone
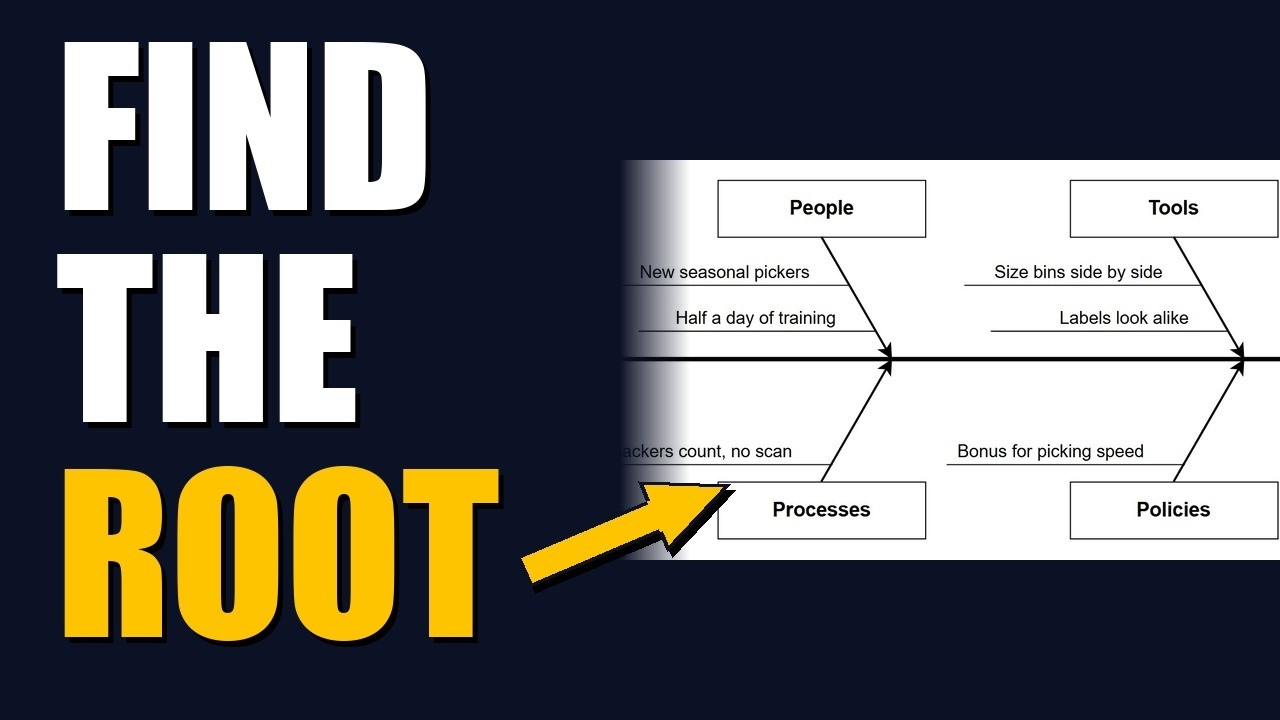
- The fishbone is also called an Ishikawa or cause and effect diagram. Write the problem in a box at one end (the head) and draw a long line to it (the spine). Add big bones for groups of causes, such as people, processes, tools and policies, then small bones for deeper causes.
Our fishbone, bone by bone
- In a 1-hour session the head reads: wrong item in 6 of every 100 clothing orders. People: new seasonal pickers with half a day of training. Processes: since March, packers count items but don't scan them. Tools: size bins side by side with near-identical labels. Policies: a speed bonus.
Tool 2: the five whys
- Pick the strongest suspect and keep asking why. Wrong size? Pickers grab from the next bin. Why? Sizes sit side by side with look-alike labels. Why alike? The size is 1 letter at the end of a long product code. Why not caught? In March the packing scan was dropped. 4 whys, 2 fixable causes.
Tool 3: check the cause with data
- Test every suspect with data. New pickers make mistakes at the same rate as old hands, and fast and slow shifts match, so not those. Mistakes jumped from 1 to 6 in 100 the week the scan was dropped, and the small warehouse kept its scan. 8 in 10 wrong items are the wrong size. 2 causes survive.
Is it really the root? Three tests
- Before calling it the root, run 3 tests. If we fixed it, would the problem stop? Can we actually fix it? Does it explain every fact: the March start, the main warehouse only, mostly wrong sizes? The scan and labels pass. If a cause fails, keep digging: you probably stopped 1 why too early.
Worked example: the one-page report
- The 1-page report: the problem and its $8,000 a month cost; root cause 1, the dropped packing scan; root cause 2, look-alike bin labels; the evidence. Step 4 picks the actions: bring back the scan, and new labels with the size in big letters. Target: under 1 in 100 within 6 weeks.
The real fix, as a requirement
- A new warehouse system is not on the page: it would cost a fortune and the shirts would still look alike. Turn the action into a requirement: the packing screen asks the packer to scan every item. Given an order for a medium blue shirt, when a large is scanned, then a red warning shows and the order can't close.
Confirm, track, follow up
- Play the report back to the customer service manager and warehouse lead to confirm it. Put the report in Confluence, the data check in Excel, and the 2 actions as Jira tickets linked to the problem. 6 weeks later, count again. Still above 1 in 100? Back to the fishbone.
5 common mistakes
- 5 common mistakes: fixing the symptom; starting with a solution; stopping at a person instead of asking why the process let it through; stopping at 1 cause when there can be more; and skipping the data, because a fishbone is only guesses until numbers back one up.
Recap
- Recap: fix the cause, not the symptom. Follow the 4 steps. Write the problem statement with 5 questions. Go wide with the fishbone, go deep with the 5 whys, prove it with data and run the 3 tests. Then count again to confirm the fix worked.
Common mistakes
- Starting with a solution. "We need a new warehouse system" is a solution, not a problem statement. Write what hurts, where, when and how much, and leave the cause and the fix out until the analysis finds them.
- Stopping at a person. "The picker made a mistake" is almost never the root. Ask why the process let the mistake through, like a dropped scan or look-alike labels.
- Treating the fishbone as the answer. A fishbone only lists possible causes. Test each one with data, like comparing new and experienced pickers, before you call it a root cause.
- Stopping at 1 cause. There can be more than 1 root cause, like the scan and the labels here. Check that your causes explain every fact, and go round the steps again if they don't.
When a business analyst uses this
When a stakeholder asks for a costly new system to fix a recurring complaint, a business analyst runs a short fishbone workshop with the people who do the work, checks the suspects against order data, and writes the real fix as a requirement with acceptance criteria, then tracks it in Jira against a target.
Questions people ask
Can root cause analysis be done proactively or reactively?
Both. Reactive analysis stops a problem that already happened from coming back, and proactive analysis looks for weak spots before they cause trouble.
What are the steps of root cause analysis?
The BABOK Guide uses 4 steps: define the problem, collect the data, identify the cause and identify the action. You may repeat them if there is more than 1 root cause.
How do you do a 5 whys root cause analysis?
Pick the strongest suspected cause and keep asking why until you reach something you can change. It may take more or fewer than 5 whys, so stop at a fixable cause, not at a set number.